Must Have Free Tool - Google Analytics
Standard web-hosting packages typically come with pretty informative web statistics packages built in that you can use to analyze the comings and goings of users to your site. Some of the more popular packages are WebTrends, Webalizer, and my personal favorite, Awstats. However, if you have a blog that is not hosted through a web host, how do you find out what is going on?
My blog is done through Blogger.com. It was free, very easy to set up, and works great, but I didn't know if anyone was visiting. I looked into Google Analytics - another great, free tool from the search engine kings. GA's primary purpose is to provide tracking and information on Google Adwords campaign, but it is also available for sites that don't use Adwords.
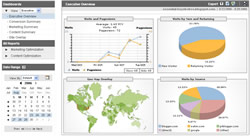
 I signed up and copied the GA code into my blog code. Then I waited 24 hours for GA to collect information. I was pleasantly surprised to see the wealth of information it had collected. You get a cool 4-part screen with different data types.
- The first quadrant is a simple color coded line graph showing the number of visits and the number of page views to your site.
- The second quadrant is a pie chart of new vs. returning visits.
- The third quadrant is a map of the world with dots showing where your site visitors came from.
- And the fourth quadrant is a pie chart of where your visitors came from, whether a direct request or referral from another site.
Beyond these pictures there are breakdowns of keywords visitors used for searching, details on which sites sent you the traffic, which pages they visited, which pages they left from and other standard traffic details.
Considering this is a free tool from Google, I give it an A+ for ease of use and value.


0 Comments:
Post a Comment
<< Home